
LE BERKELEY CARBON TRADING PROJECT
Introduction to Berkeley’s Carbon Trading project
Developed by UC Berkeley’s Goldman School of Public Policy, the Berkeley Carbon Trading Project is a research and outreach program dedicated to studying the effectiveness of offset programs on voluntary carbon markets (VCMs). As part of this program, a database of 8,559 GHG reduction and absorption projects, as well as emissions and withdrawals of carbon credits worldwide, has been set up. This database, known as the Voluntary Registry Offsets Database, includes all projects registered by the four major international registrars of voluntary offset projects: American Carbon Registry (ACR), Climate Action Reserve (CAR), Gold Standard and Verra (VCS).
The administration and operations of three of these registries are located in the United States, and one in Europe. Together, the registries of the four registrars generate almost all the world’s voluntary carbon market credits. However, there are dozens of smaller programs and registries around the world. In doing so, the Berkeley database facilitates the transparency of voluntary carbon market information for researchers and buyers by giving them access to project and credit data on a single database. This article examines the 9th version of the database, dated November 1, 2023.
Project Classification in the Berkeley Database
The program developed by Berkeley adopts its own classification of offset projects. There are the following 9 sectoral areas made up of several project types::
- Agriculture (Biochar production and use, Compost batch production and soil application, Compost addition to pastures, Feed additive use, Improved irrigation management, Farm digester use, Nitrogen management, Rice emission reductions, Solid waste separation and Sustainable Agriculture)
- Carbon capture and storage (Carbon capture and enhanced oil recovery, Carbon capture in concrete and Carbon capture in plastics)
- Chemical processes (N2O destruction in adipic acid production, N2O destruction in nitric acid production, Propylene oxide production, SF6 replacement and Refrigerant projects)
- Households and communities (Biodigesters, Group energy efficiency, Clean Water, Community wells, Furnaces, Lighting and Weatherization)
- Industry and commerce (Reducing emissions from aluminum smelters, Reducing emissions from brick manufacturing, Producing carbon-absorbing concrete, Energy efficiency, Fuel switching, Electricity grid extension, Detecting and repairing leaks in gas networks, Mining methane capture, Electricity generation from natural gas, Oil recycling, Plugging oil and gas wells, Pneumatic retrofitting, Reducing emissions from road construction, Reducing emissions from university campuses and Waste gas recovery, Waste heat recovery)
- Forestry and land use (Afforestation/reforestation, Avoided forest conversion, Avoided grassland conversion, Improved forest management, REDD+ (Reducing emissions from deforestation and forest degradation), Jurisdictional REDD+, Sustainable grassland management and Wetland restoration)
- Renewable energy production (Biomass, Geothermal, Hydropower, Renewable energy bundles, Solar energy (centralized), Solar energy (distributed), Solar lighting, Solar water heaters and Wind energy)
- Transportation (Bicycles, Electric vehicles and charging stations, Fleet efficiency, Fuel transport, Public transport, Marine transport and Truck stop electrification)
- Waste management (Biochar, Composting, Methane recovery and destruction from landfills, Methane recovery from wastewater, Waste detour, Waste incineration and Waste recycling.
CONTRASTING PRODUCTION VOLUMES BY SECTOR
The Berkeley database provides an overview of the vast majority of reduction and absorption projects, enabling us to identify the predominant trends in the voluntary global carbon market. In total, the four programs in the Berkeley database have issued 1,918,602,388 carbon credits.
These are classified into the 9 sectoral areas mentioned above and illustrated in Figure 1:
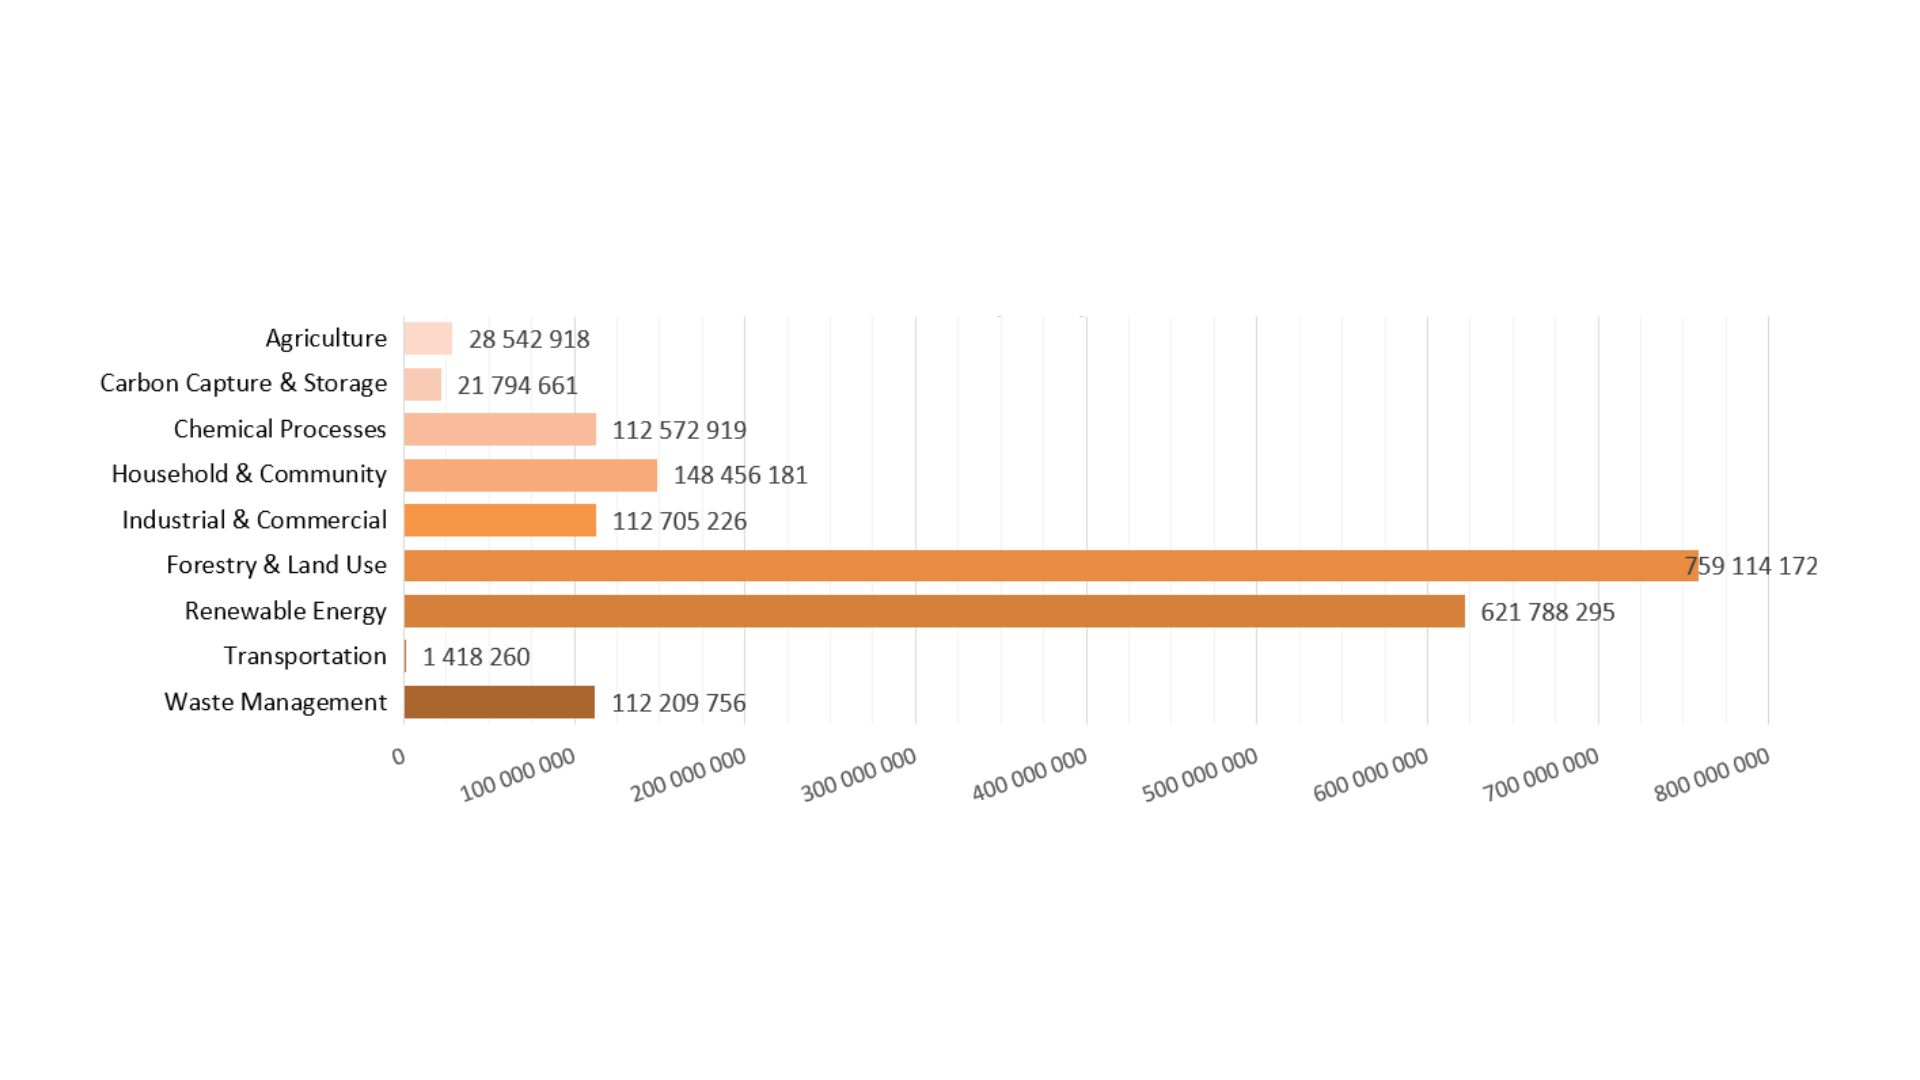
Figure 1 : Carbon credit emissions by sector (Université de Berkeley, 2023)
As mentioned, there are dozens of project types in the nomenclature of the various fields. However, there are major discrepancies in terms of carbon credits emitted by the various projects. The contribution of each project type is detailed in Figure 2 below:
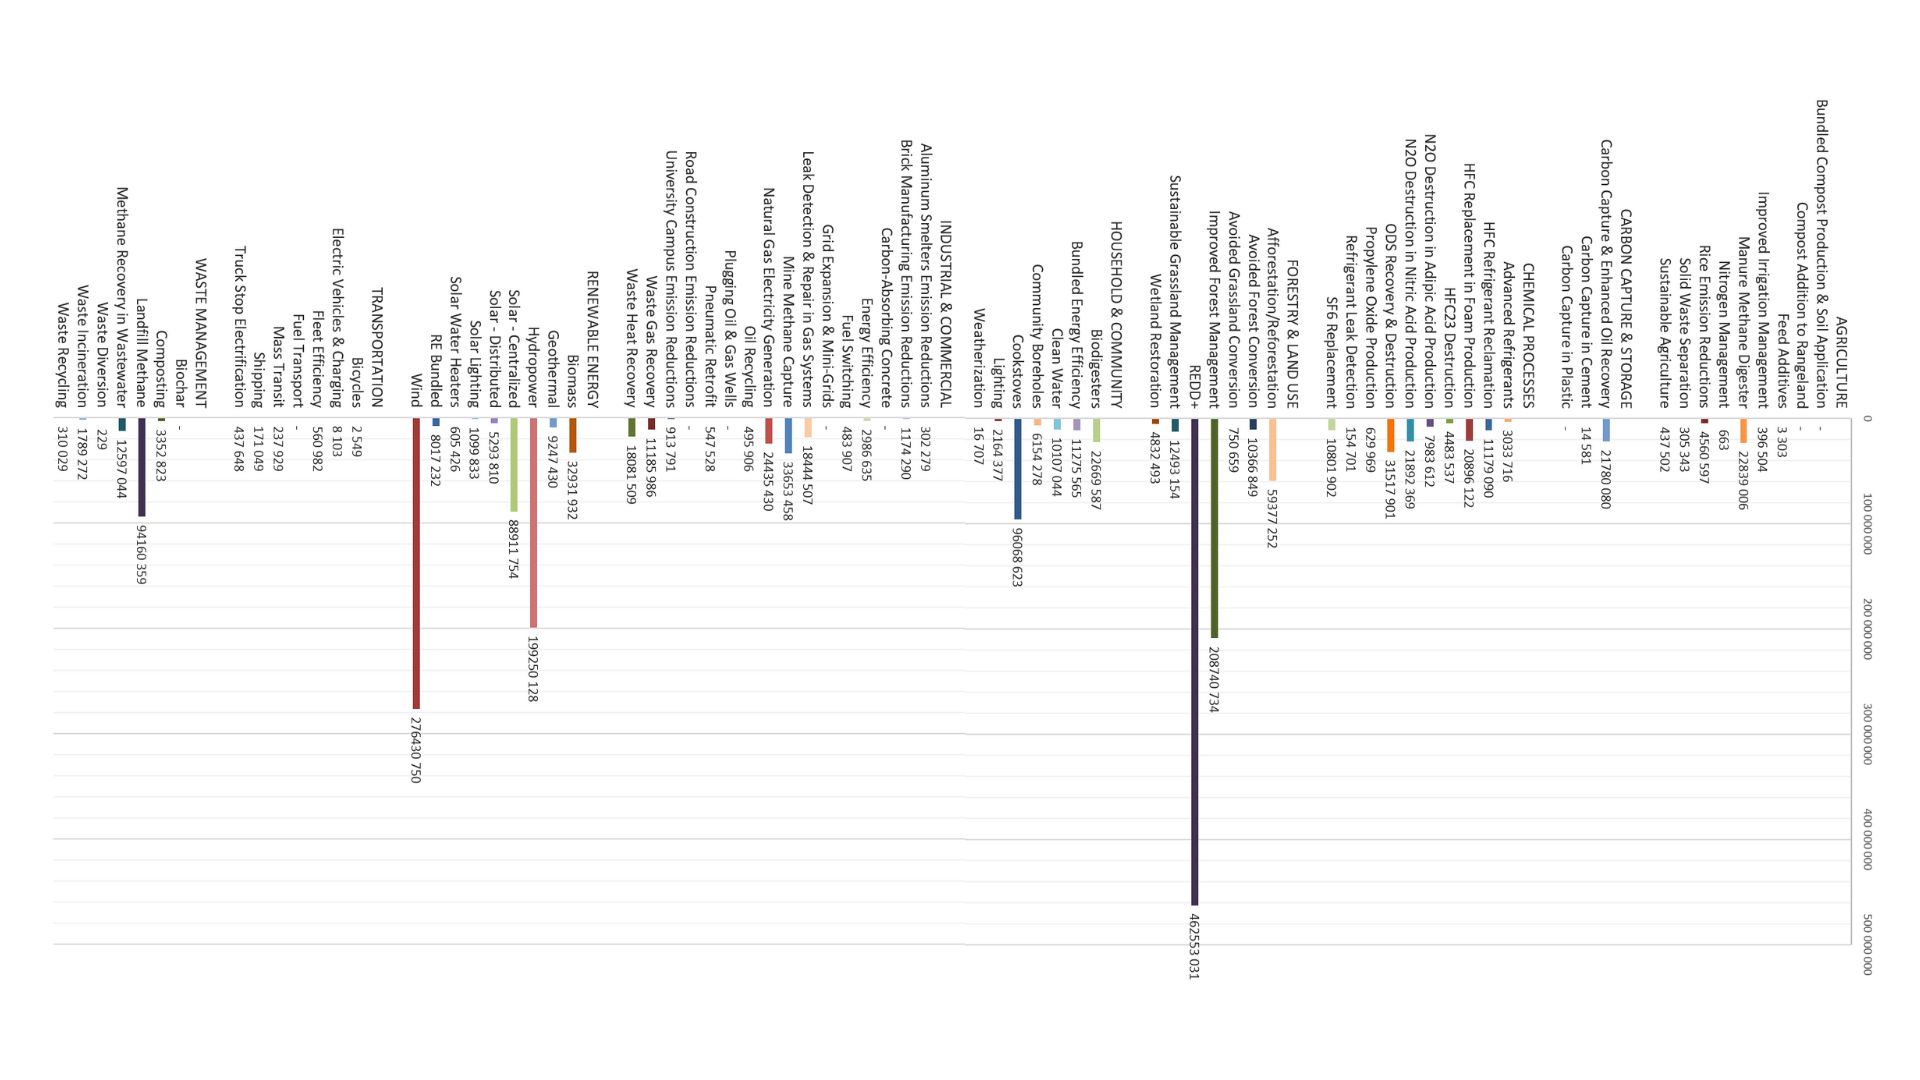
Figure 2 : Carbon credit emissions by project type (UC Berkeley, 2023)
Forestry and Land Use
The Forestry and Land Use sector generates the majority of carbon credits sold on voluntary markets worldwide, accounting for 40% of the global credits in the database, representing 759,114,172 credits issued through 1,481 projects. This large number of carbon credits is attributable to two main types of project.
Firstly, projects to reduce emissions from deforestation and forest degradation (REDD+) generate the most credits within this sector. In fact, this type of project alone is responsible for the emission of 462,553,031 carbon credits, i.e. 61% of credits in the Forestry and Land Use sector and 24% of all credits issued in the database.
However, these calculations have been called into question by several independent studies. They question the reduction estimates for REDD+ projects, claiming that they are greatly overestimated (The Guardian, 2023).
Improved forest management projects are also responsible for 208,740,734, or 27% of this sector.
Renewable Energies
The Renewable Energies sector accounts for 32.4% of the global credits in the database, i.e. 621,788,295 carbon credits issued by 2,322 projects. It is the second most important sector in terms of carbon credits generated. Among the types of project within this sector, 44% were wind power, 32% hydroelectric and 14% solar.
Households and Communities
In third place, the Households and Communities sector accounts for 7.7% of the global credits in the database, with a total of 148,456,181 credits issued by its 2,396 projects. Despite the high number of projects worldwide, their relative value in terms of credit emissions is much lower than that of Forestry and Land Use.
Despite this, one type of project accounts for 65% of the credits issued by the Households and Communities sector: clean cookstoves. However, the carbon credits issued by this type of project are also called into question by a study which claims that the reductions are overestimated (Nature Sustainability, 2023).
Three sectors with Similar Volume Contributions
Next, the three sectoral areas of Industry & Commerce, Chemical Processes and Waste Management are respectively responsible for 112,705,226, 112,572,919 and 112,209,756 carbon credits. Each of the three sectoral areas therefore represents around 6% of the global credits in the database.
The Industry & Commerce sector has 16 types of projects, the most developed of which are gas network leak detection and repair, mining methane capture and electricity generation from natural gas.
The Chemical Processes sector consists mainly of projects relating to refrigerant management.
The Waste Management sector generates carbon credits mainly from a single type of project: the recovery and destruction by flaring of biogas (methane) from landfill sites. This type of project accounts for 84% of the credits issued in this sector, but could be reduced as legislation becomes more stringent.
It is followed at a distance by wastewater methane recovery projects, which account for just 11.2% of credits issued within the sector. The remaining 4.8% of credits in the Waste Management sector include projects to divert waste from landfill, recycling and composting.
These types of projects upstream of landfill represent Will Solutions’ core target within the Waste Management sector. However, they still represent niches that have yet to be exploited by promoters of greenhouse gas reduction and absorption projects.
Lower-volume sectors
Lastly, the Agriculture, Carbon Capture and Storage and Transport sectors are respectively responsible for the emission of 28,542,918 credits (1.5% of total credits), 21,794,661 credits (1.5% of total credits) and 1,418,260 credits (0.07% of total credits). They represent the smallest sectoral areas in the database in terms of carbon credits issued. The Agriculture sector consists mainly of projects involving the use of digesters on farms. The Carbon Capture and Storage sector is mainly made up of projects to capture carbon dioxide from industrial processes and improve oil recovery. Transport, on the other hand, is the least important sector in terms of carbon credits issued. Its projects mainly involve the electrification of transport.
PROJECTS MAINLY LOCATED IN THE “GLOBAL SOUTH”
If we look at the origin of the carbon credits issued, we can see that the production of carbon credits is greater in certain regions of the world. The distribution of carbon credits in the Berkeley database by world region is illustrated in figure 3 below:
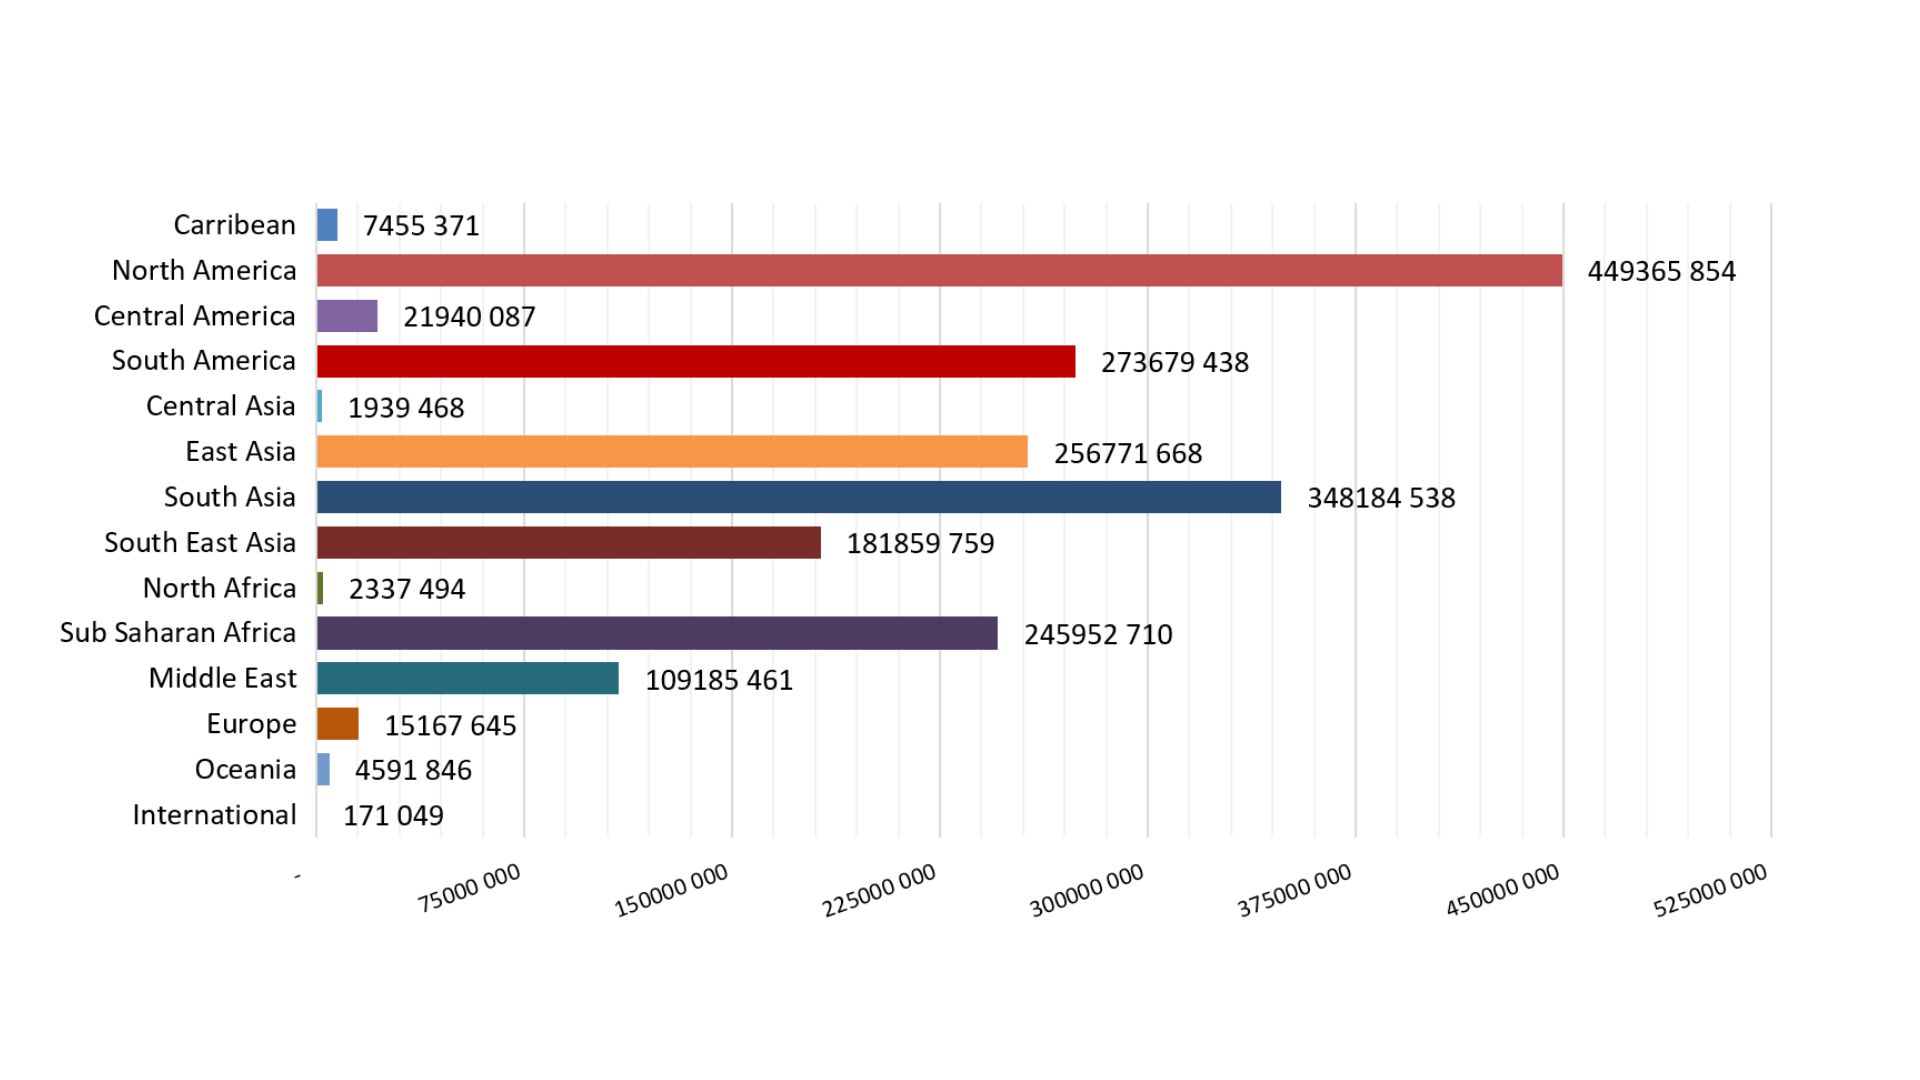
Figure 3: Distribution of carbon credits issued by region (University of Berkeley, 2023)
On the one hand, it can be seen that the majority of projects have been developed in the countries of the Global South. The Global South is made up of countries considered to have a relatively low level of economic and industrial development. They are generally located to the south of more industrialized nations.
Although the United States is an exception, the cumulative credits issued from Central America, South America, Asia, Africa and the Middle East total 1,449,305,994 credits. Among the countries of the Global South, those producing the most credits are: India (317,294,469 credits issued), China (317,294,469 credits issued), Brazil (111,815,322 credits issued) and Turkey (108,340,420 credits issued).
The vast majority of projects in these countries are in the Forestry & Land Use and Renewable Energies sectors. In these regions, Verra’s Verified Carbon Standard (VCS) program issues the most credits. It issued 1,163,489,277 credits in these countries, representing 80% of credits issued in the Global South regions.
On the other hand, Western countries in the Global North are not following the trend. In Europe as a whole, only 15,167,645 carbon credits were issued. In North America (excluding the United States), 13,720,381 credits were issued. In Oceania, only 4,591,846 were issued.
The United States is an exception, however, since it alone issued 435,645,473 carbon credits, more than India. Of the credits originating from the USA, 48.5% come from the American Carbon Registry (ACR), 37.5% from the Climate Action Reserve (CAR), 13.9% from the Verra Registry (VCS) and 0.006% from the Gold Standard Registry.
In total, all Western countries (excluding the USA) issued just 33,479,872 carbon credits. If we include US emissions in this calculation, we obtain a total of 469,125,345 credits issued within the Global North, i.e. only around 1/3 of emissions from the Global South. These findings reflect a strong potential for the development of new reduction projects within Global North countries, as part of their NDC (Nationally Determined Contributions) commitment initiated during the Paris Agreement in December 2015.
What’s more, the reduction and absorption projects set up in Global South countries offset the majority of emissions from Northern countries, which raises ethical questions. Western countries could do more to undertake reduction projects on their own territory, in order to decarbonize their economies and sell carbon credits emitted locally.
A PARTIAL CLASSIFICATION OF SUSTAINABLE COMMUNITY PROJECTS
Will Solutions (WILL) develops reduction macro-projects called Sustainable Communities. These are umbrella (or grouped) projects that enable SMEs, NPOs and municipalities voluntarily committed to decarbonization to enter the voluntary carbon market via a local community, and thus aggregate the reductions from their individual projects into a single common project.
Limitations of the Berkeley database
WILL certifies these carbon credits using Verra’s Verified Carbon Standard (VCS) program. Projects eligible for Sustainable Communities are currently limited to the VCS program’s sector areas (3) Energy Demand and (13) Waste Management. Sectoral area (7) Transport will soon also be eligible. Considering this multi-domain business model, one might wonder how the two Sustainable Communities in Quebec and Ontario are classified on the Berkeley database.
In fact, the Berkeley database classifies the Quebec Sustainable Community (QSC) in the Industry & Commerce sector as an energy efficiency project. As for the Ontario Sustainable Community (OSC), it is classified within the Households and Communities sector, as a bundled energy efficiency project.
Incomplete classification of complex projects
This difference in classification is surprising, given that the only difference between these two communities is their location. The nature of their projects, however, remains unchanged. Both projects should therefore be classified identically. The conclusion is that Berkeley’s nomenclature of 9 sectoral domains does not allow for the specific identification of multi-sectoral projects such as those of WILL.
Survey to classify grouped projects
We therefore conducted an internal survey within the WILL’s team. We asked all employees to classify Sustainable Communities projects into one of the 9 sectoral domains proposed by the Berkeley methodology. The results of this survey can be seen in figure 4 below:
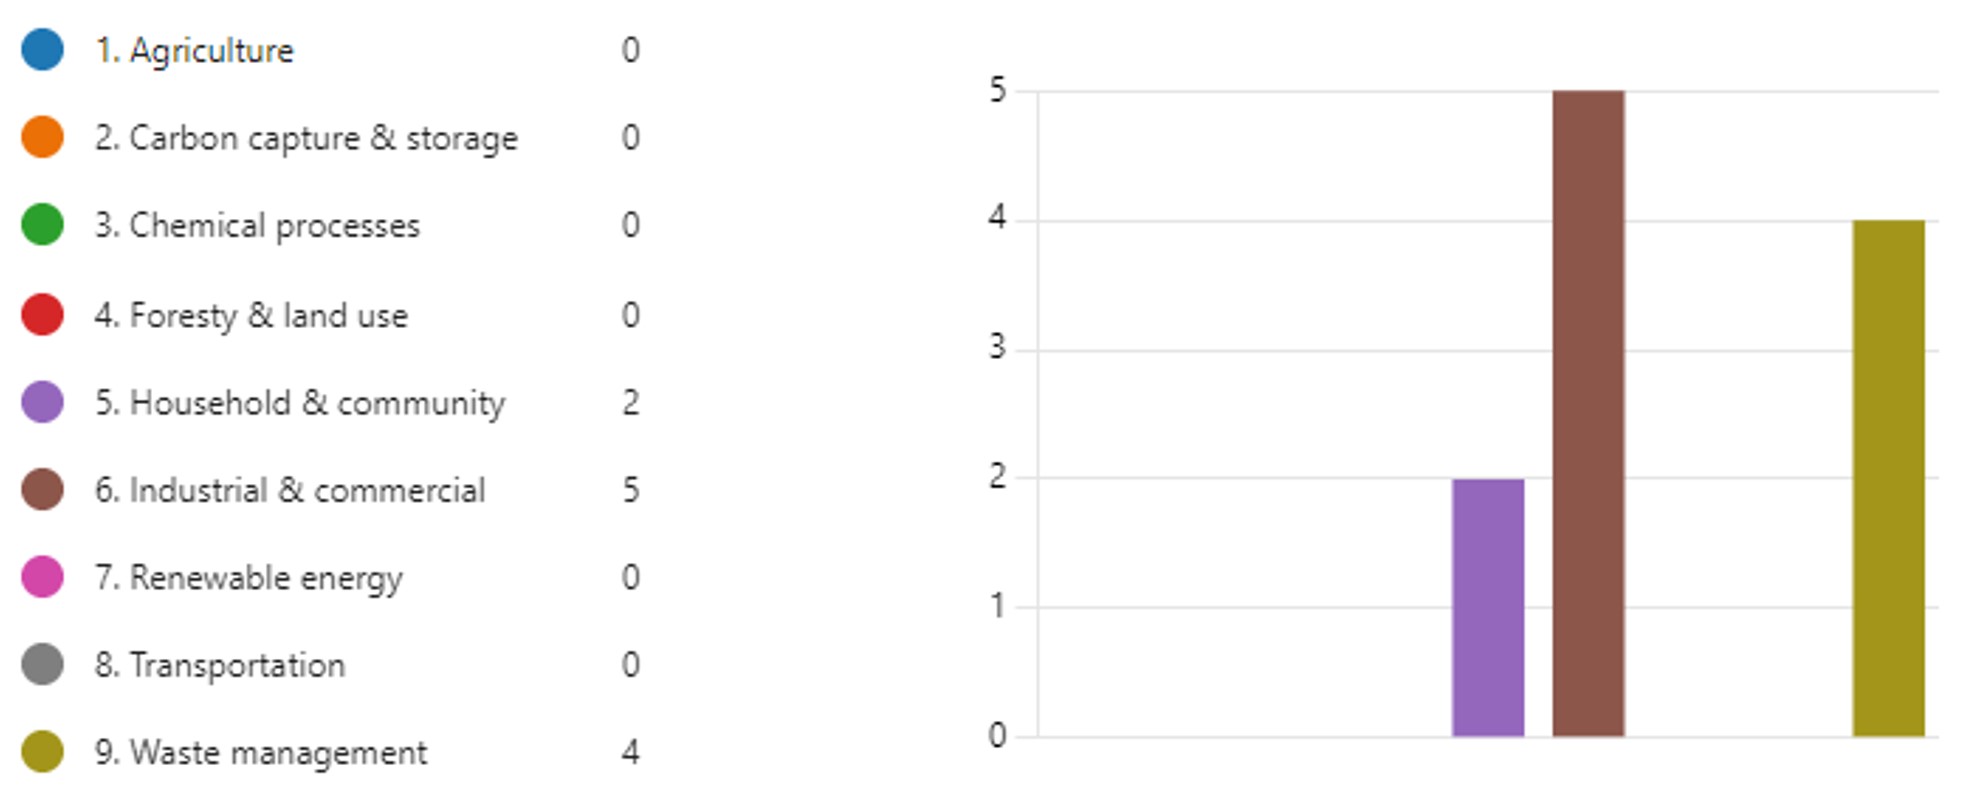
Figure 4 : Will Solutions internal survey results
Respondents’ answers were divided into three sectoral areas: Waste Management, Industry & Commerce and Household & Community.
Three different logics were adopted to make this choice.
- By type of project: the first was to choose the Waste Management sector, since it includes the types of project that generate around 75% of the carbon credits issued by WILL.
- By project owner: the second is Industry & Commerce, since our project developers and customers (members) are mainly industrial and commercial companies.
- By ecosystem: the third rationale focuses on the diversity of project types present within the Household & Community sector. This latter area includes project types equivalent to the majority of PAIs (Projects Activities Instance) operated by WILL within the VCS program.
Will Solutions‘ recommendations and conclusions for the classification of grouped projects
So who’s right? By equating Verra’s sector fields with those of the Berkeley database, it is possible to better classify WILL‘s projects. Sustainable Communities projects should be included in two sector areas: Households and Communities and Waste Management. However, these two areas are not the most developed in terms of credits issued. The same applies to the Transport sector, which will soon be operated by Will Solutions.
For example, in the Global North as a whole, Transport, Households and Communities and Waste Management are responsible for issuing 963,002 credits, 902,505 credits and 60,272,247 credits respectively (including 55,052,628 credits from landfill methane recovery and destruction projects). The credits issued by these three sectors within the Global North therefore represent just 3.2% of the total credits issued worldwide. This reflects the strong development potential of Sustainable Communities in these countries, enabling them to add this tool to their NDC (Nationally Determined Contribution) targets.
The incomplete classification of complex projects such as WILL’s Sustainable Communities represents the main weakness of the Berkeley database. However, it also makes it possible to affirm, by deduction, the innovative nature of Will’s Sustainable Communities (which covers 3 sectoral areas) by using the building as the calculation perimeter.
Summary of key findings
Analysis of the Berkeley database leads to several observations:
- The Forestry and Land Use and Renewable Energies sectors account for the vast majority of carbon credit emissions worldwide;
- With the exception of the United States, there is a contrast between the Northern and Southern Hemispheres. Global South countries concentrate the majority of reduction and absorption projects. As for the countries of the Global North, they remain hesitant in developing projects under the four voluntary initiative programs analyzed;
- The countries of the Global North have a strong potential for developing new projects, beyond their national regulations, which could support the achievement of their NDCs (Nationally Determined Contributions), by stimulating local reductions;
- Berkeley’s database provides a classification of projects operating simultaneously in several areas, but this needs to be improved;
- Will’s Sustainable Communities are innovative umbrella projects that are unique in the world;
- A forthcoming article will look at the origins of voluntary project development in the USA compared with Europe and the rest of the world.

Mathis Chanvillard
Auditeur GES
Auteur et rédacteur
BIBLIOGRAPHY
University of Berkeley. (2023). Voluntary Registry Offsets Database.
https://gspp.berkeley.edu/research-and-impact/centers/cepp/projects/berkeley-carbon-trading-project/offsets-database
The Guardian. (2023). Revealed: more than 90% of rainforest carbon offsets by biggest certifier are worthless, analysis shows.
https://www.theguardian.com/environment/2023/jan/18/revealed-forest-carbon-offsets-biggest-provider-worthless-verra-aoe
Nature Sustainability. (2023). Pervasive over-crediting from cookstove offset methodologies.
https://www.nature.com/articles/s41893-023-01259-6.epdf?sharing_token=NkYMV0i2k-71BnCVChc2stRgN0jAjWel9jnR3ZoTv0PY5koFksowKMxA7MIi6wx9OA04W8v_UKPTy7CKTglfUCvTI93MdjiaHTsUGRasUK2DG7Mxl7htCwwOiKlSXJL-qkrLRw6h9BbxA17jIEjcKoqw2E6ucNSM00hdlxKJSKKG9tCl4u_QsBZMRGAHY8_c7Rkm3aAxc1oOKbZDAjvyYqa608R4kAF1p2JLxE90HR0UxpGv_tvIylLks5PVezAXSO-Hwmbp5-s5IFL_eVmYn4sJFnojXPv8yeAn1HJFj5fYpY7_YCW0LtFeEbOGKCZX-2vUEm5LDJsT1lT8MPLjB-2qFle22BOVerK7lbjr6xc%3D&tracking_referrer=www.theguardian.com