This article briefly presents the evolution of Quebec’s GHG emissions from the transportation, waste management, and commercial and institutional buildings sectors. It also presents the total GHGs produced between 2013 and 2019, since the implementation of the cap-and-trade system for greenhouse gas emissions (CATS).
Total emissions in 2019 are 84,318 kt CO2e. The sector that produced the most GHG emissions in Quebec was transportation (road, air, sea, rail and off-road), which is estimated at 36,518 kt CO2e, or 43.5% of the total. Then, residual materials with 6,584 kt CO2e, or 9% of the total. And finally, the commercial and institutional sector (heating of buildings) is estimated at 4,925 kt CO2e, or 6% of the total.
Total GHG emissions produced in Quebec :
From 2013 to 2019, Quebec’s GHG emissions increased by 2.2%, from 82,493 kt CO2e in 2013 to 84,318 kt CO2e in 2019. Overall, there is a variable decrease during the first 4 years (2013-2016) followed by an increase of 2,500 kt CO2e in 2017. The level of Quebec’s emissions is maintained for 2018 with 83,040 kt CO2e and then increases to 84,318 kt CO2e in 2019 as can be seen in Figure 1. Since 2014, the increase in GHGs is mainly linked to the growth of freight transport.
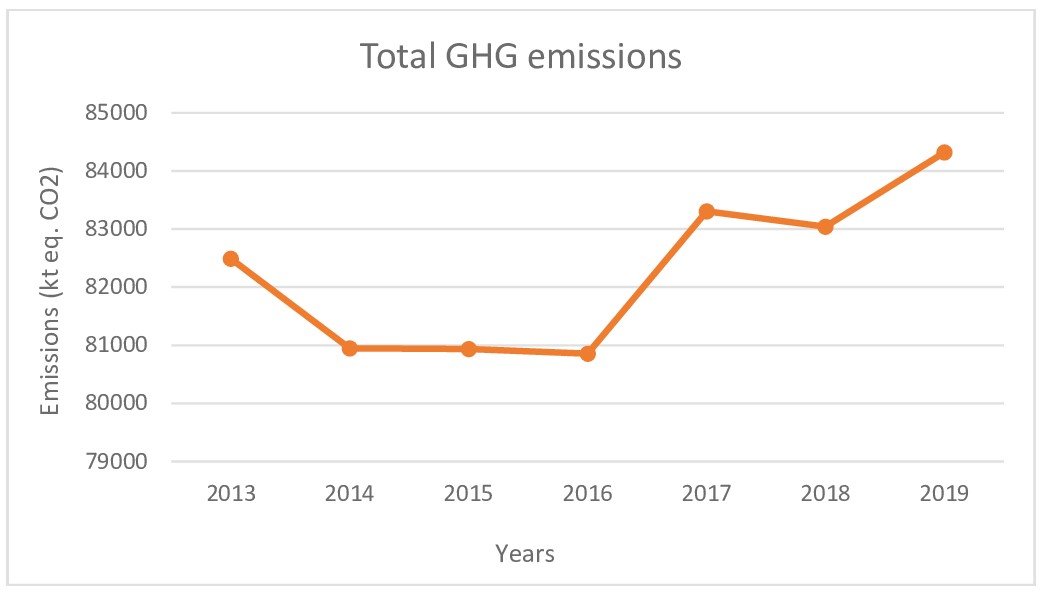
Figure 1: Quebec’s GHG emissions (2013-2019).
Transportation-related emissions :
In Quebec, the transportation sector is the main GHG emitter. Its emissions reached 36,518 kt CO2e in 2019, representing 43.5% of total GHG emissions. Between 2014 and 2019, there was an increase of 9.5% (Figure 2). This is due to the popularity of large personal vehicles and the growth of freight transportation.
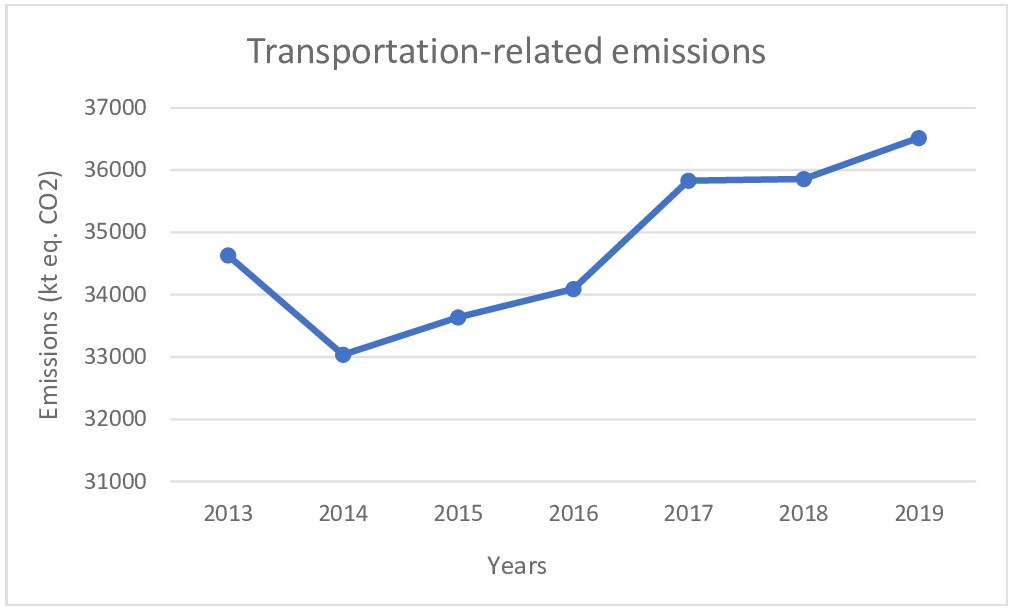
Figure 2: Quebec’s GHG emissions related to transportation between (2013-2019).
Emissions related to waste management :
The waste sector generated 6,584 kt CO2e, which represents 9% of total GHG emissions, mainly in the form of methane (CH4). Landfilling of municipal waste alone is directly responsible for 91% of the sector’s emissions in 2019, which amounts to 6,000 kt CO2e.
As shown in the figure below, there is a variation in emissions from 2013 to 2015, peaking in 2016 and beginning a decrease in emissions until 2019, from 6,996 to 6,584 kt CO2e, representing a decrease of 6%. This decrease is mainly due to the implementation of biogas capture systems in several large municipal landfills with, in some cases, energy recovery. It should be noted that significant quantities of recycled waste (mixed paper) exported in bales to countries such as China and India were found. They have a contamination rate of 25% and are therefore mixed with other materials, mainly plastic, which is largely above the legal limit in these countries. At least 100,000 tons of non-recyclable plastic were sent to India from Canada in bales of mixed paper. The difficulty is that there is no traceability for materials sold outside of Canada.
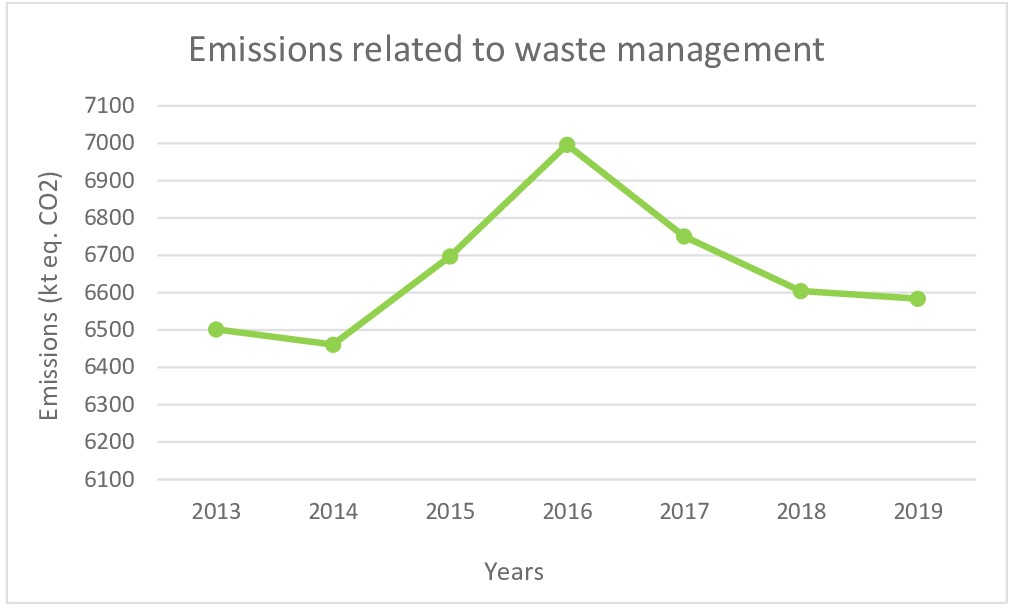
Figure 3: Quebec’s GHG emissions related to residual materials (2013-2019).
Interested in questions about residual materials? Discover our other article on waste management here.
Commercial and institutional building emissions :
In the commercial and institutional sectors, emissions increased by 16.5% between 2013 and 2019. (from 4,260 kt CO2e. in 2013 to 4,925 kt CO2e, which represents 6% of total GHG emissions). There has been an almost continuous increase in GHG emissions since 2013 with a slight decrease between 2017 and 2018 as can be seen in Figure 4. This increase is caused by the use of fossil fuels for heating buildings such as natural gas, fuel oil, propane, etc., which remains widespread. Variations in winter temperatures can also have an influence on GHG emissions from this sector5.
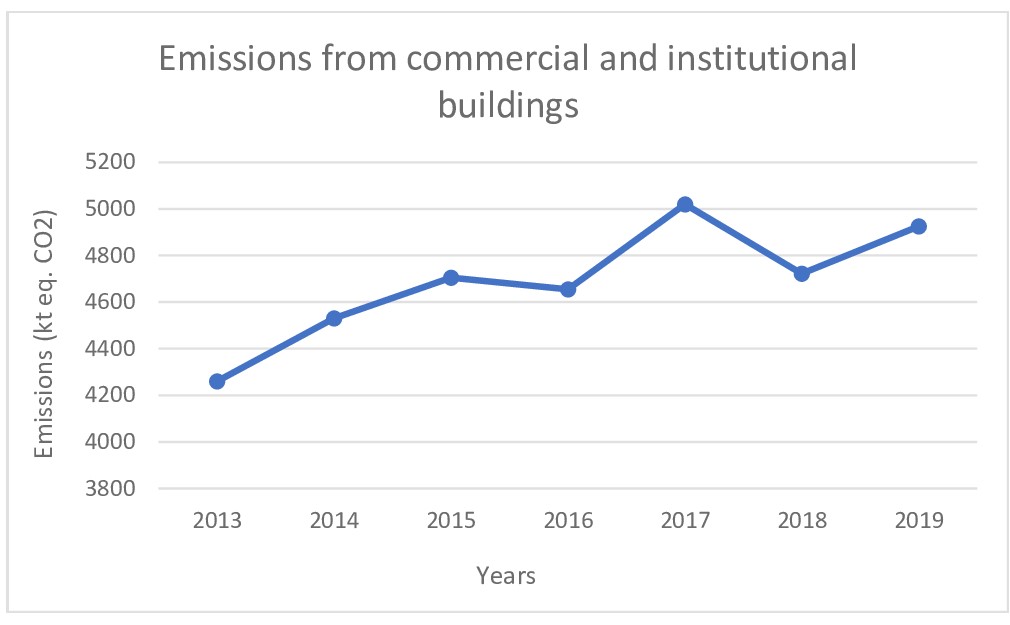
Figure 4: Quebec’s GHG emissions related to commercial and institutional buildings (2013-2019).
What conclusion for GHG emissions in Quebec, between 2014 and 2019?:
Since the implementation of the CATS on January 1, 2013, GHG emissions in Quebec have essentially followed an upward curve until 2019. The transportation and commercial and institutional building sectors are on the rise. The transportation and commercial/institutional building sectors are increasing, while the waste management sector is decreasing, although a recent issue concerning the purpose of selective collection, sorting, and export of recycled materials overseas raises some questions.

Djamil Riadh Debbouz
GHG auditor
Article’s author